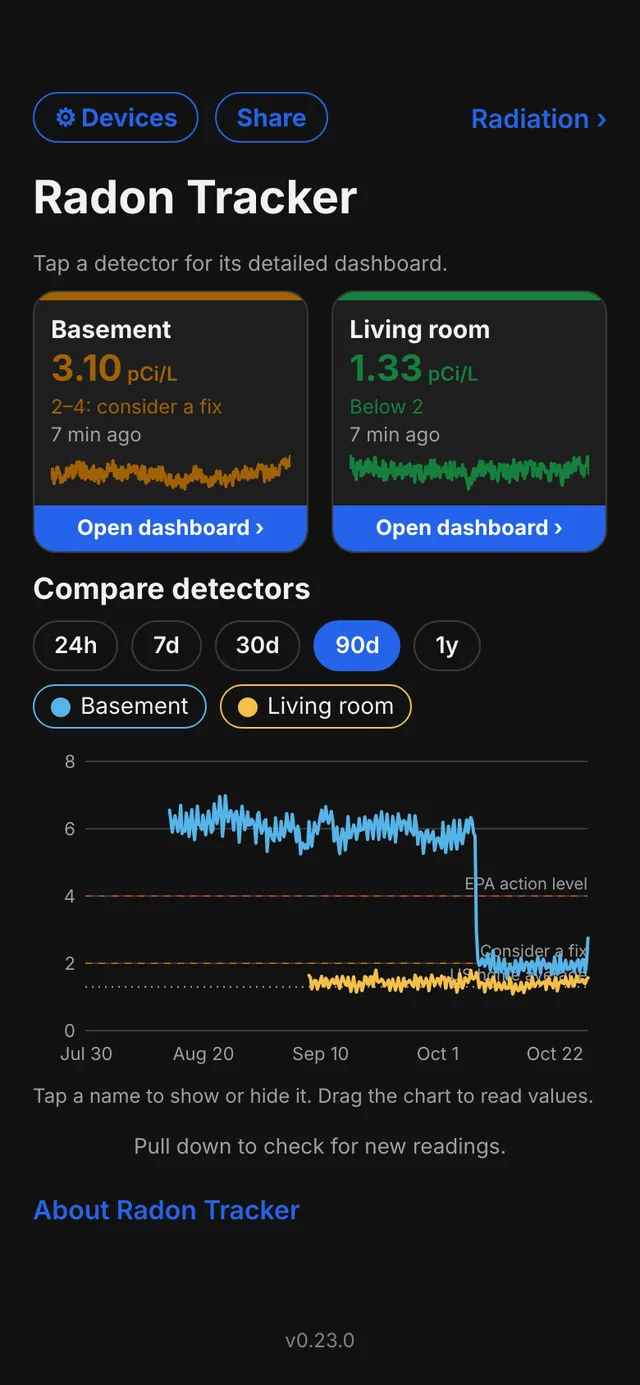
Every room on one chart
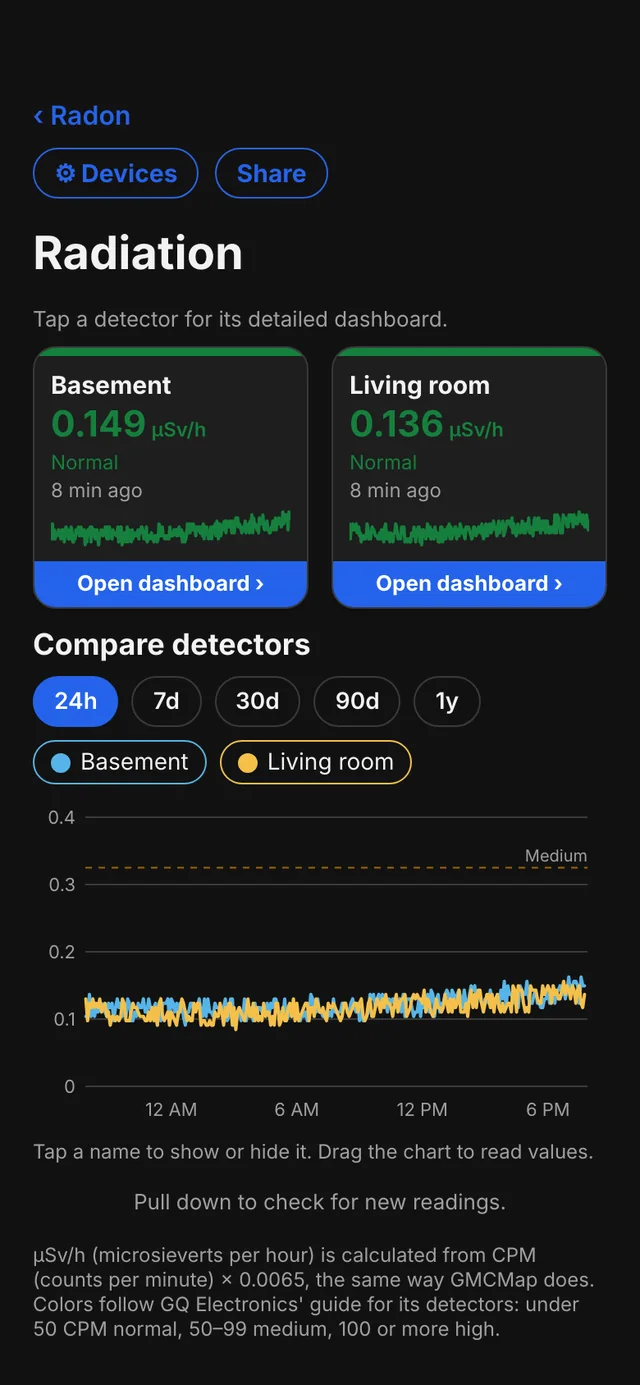
A line per detector, so you can see which part of the house needs attention.
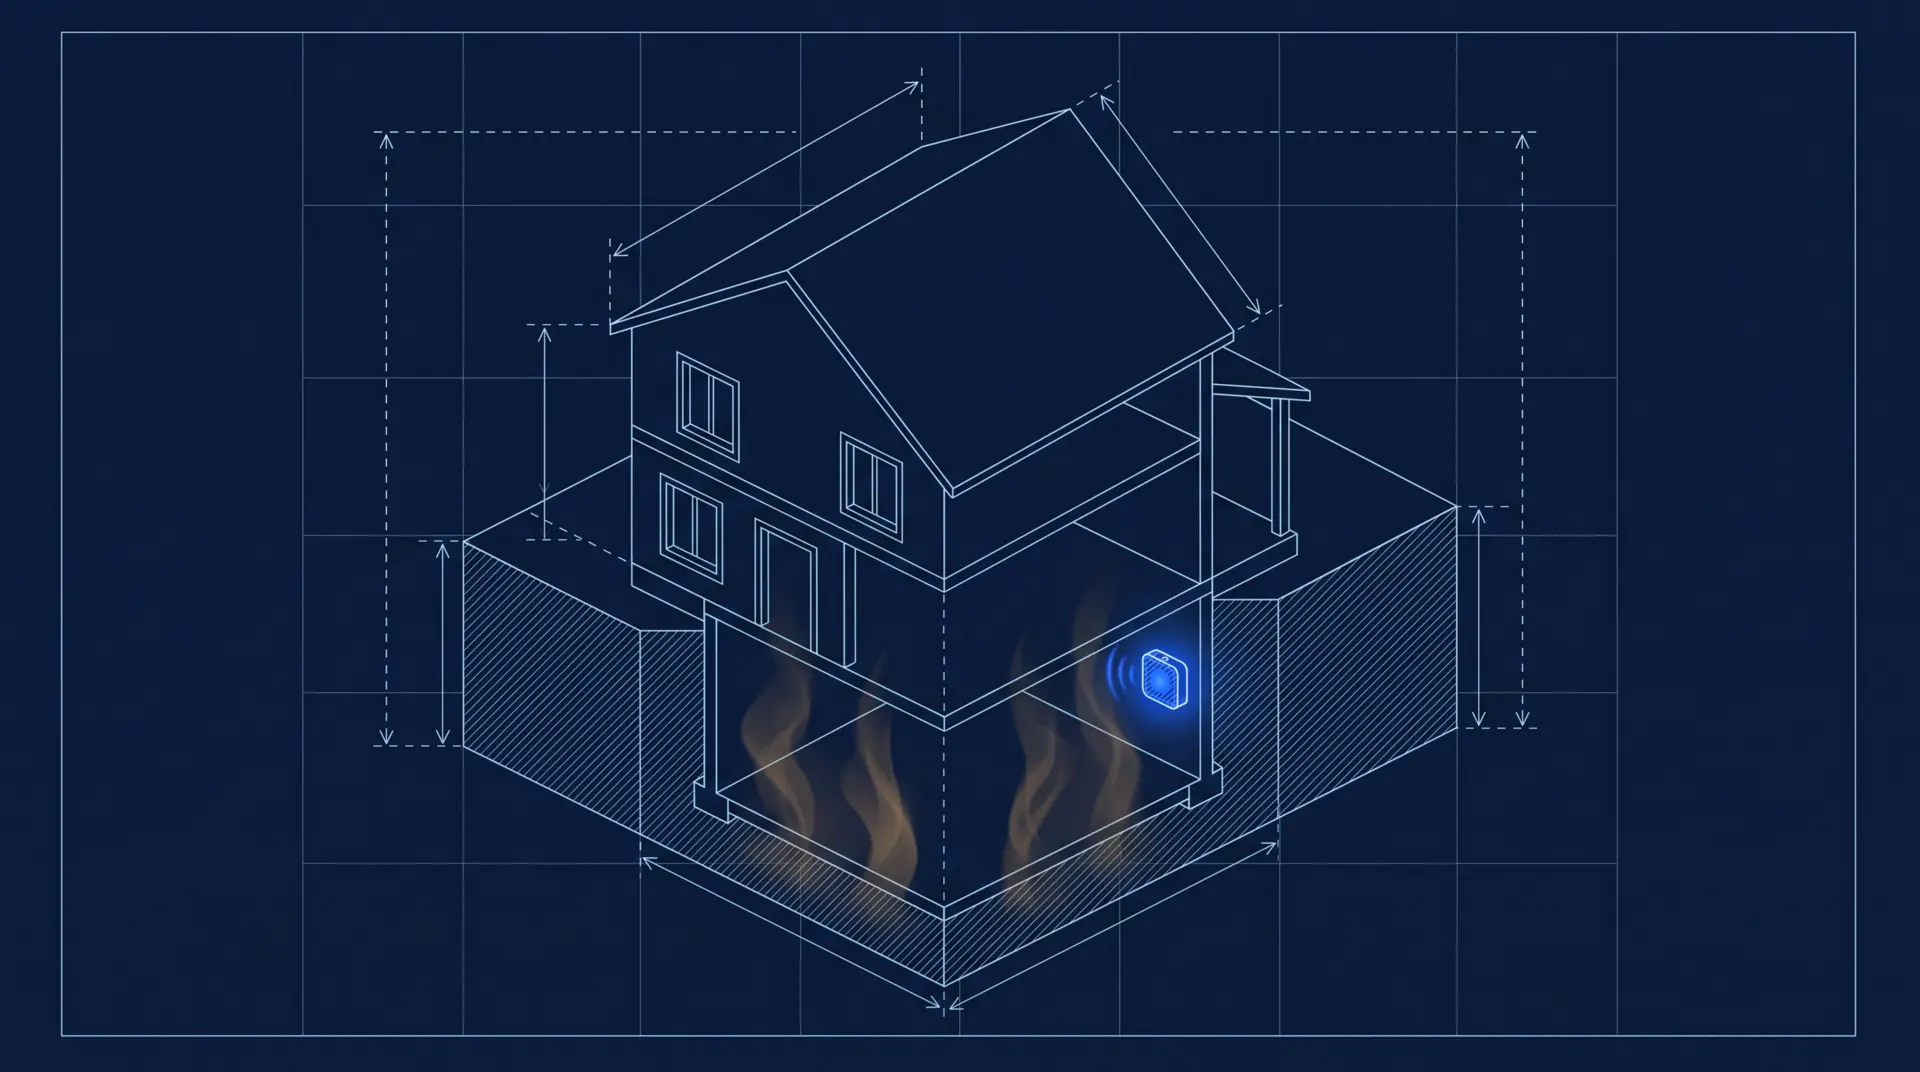
Radon is invisible, has no smell and is the second leading cause of lung cancer. Radon Tracker turns your detector's readings into a clear answer: are we fine, or do we need to act?
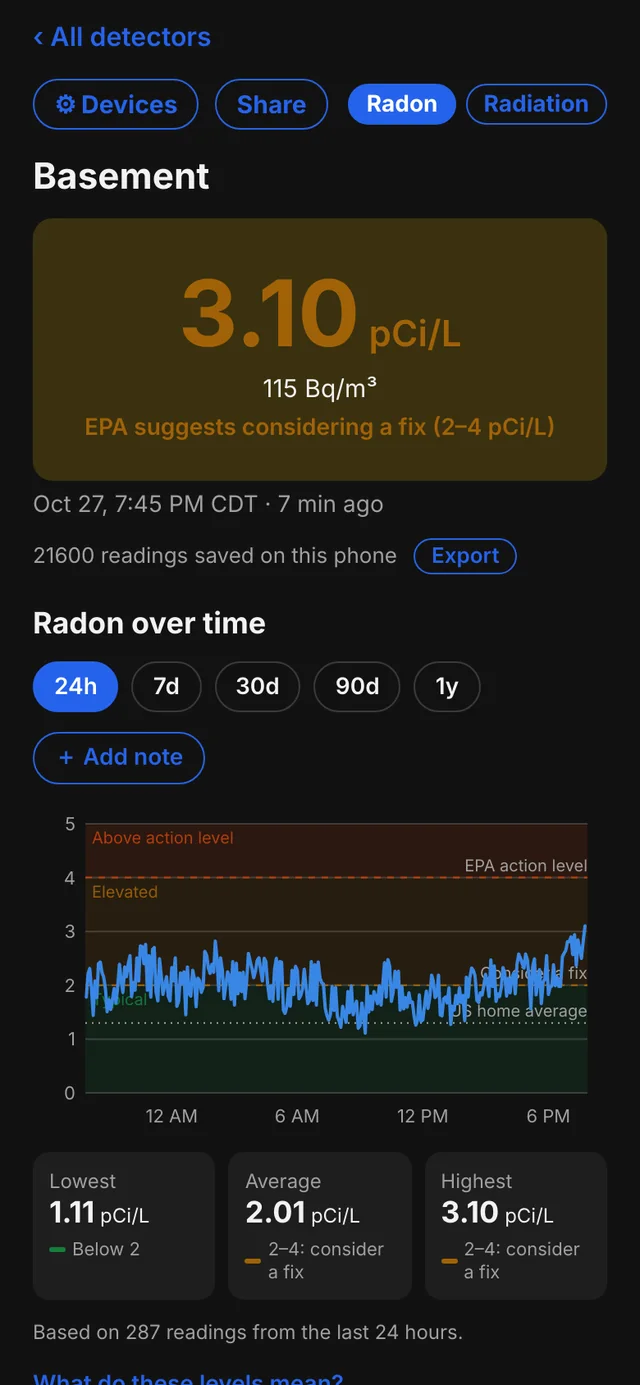
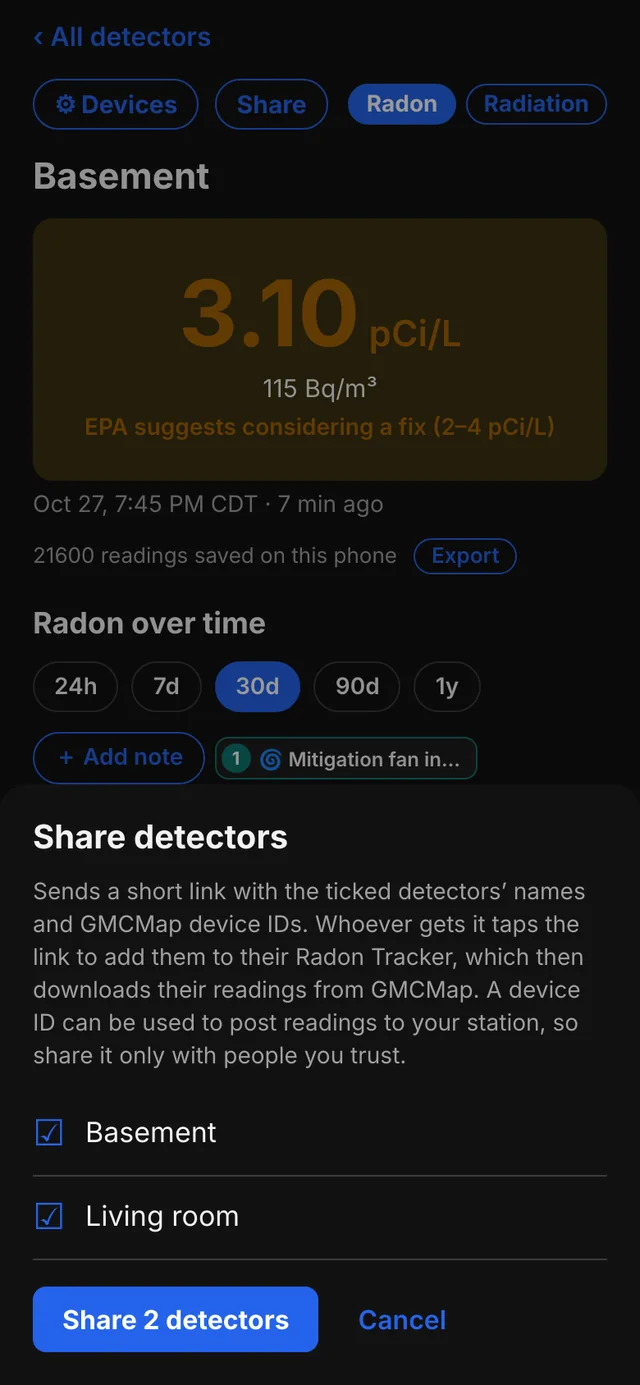
Each detector shows its latest reading big, colored and named by EPA level. Tap one for its history, drag across the chart to read any moment, and watch new readings land on their own.
Levels in pCi/L. 4 pCi/L is the EPA action level.
From the last 24 hours to the last 90 days, with the guideline lines drawn right on the chart. A chart engine built from scratch.
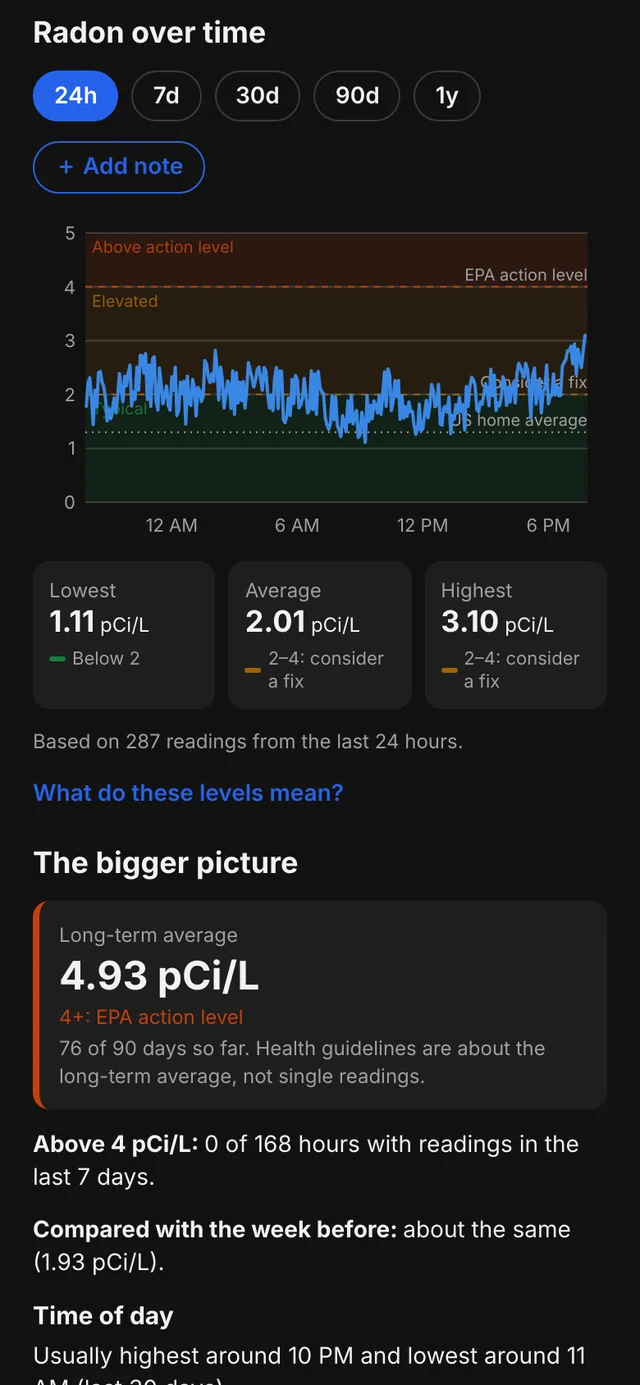
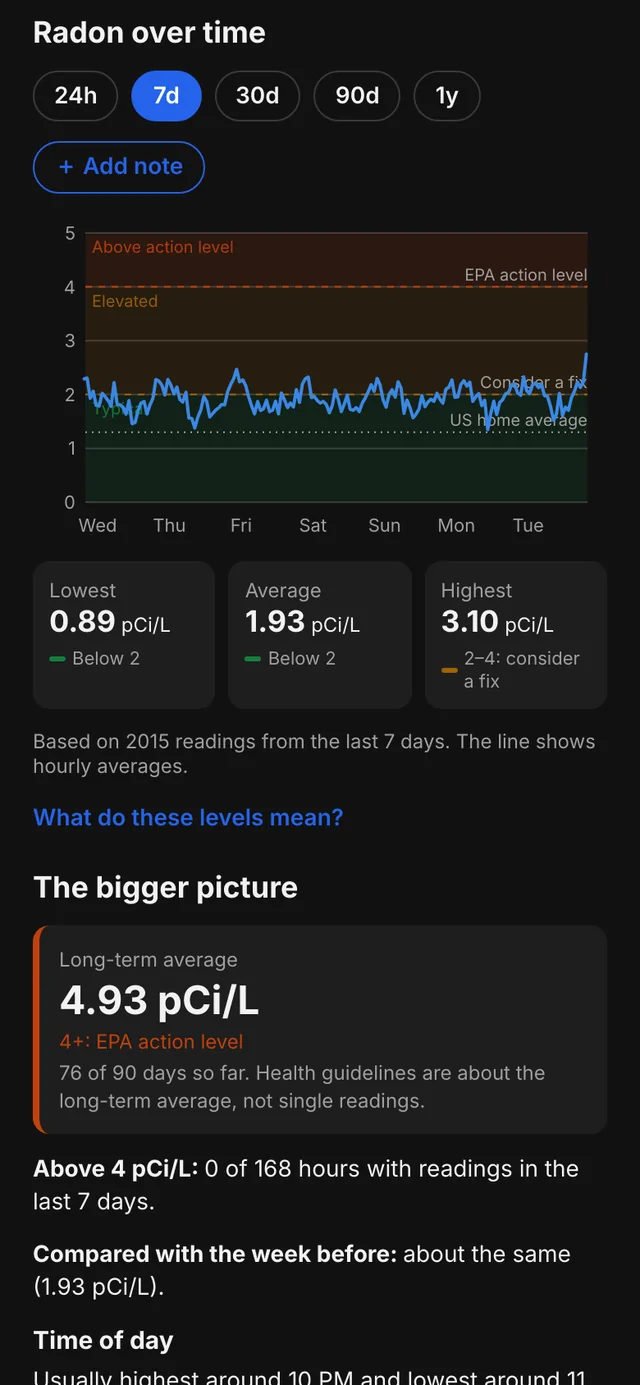
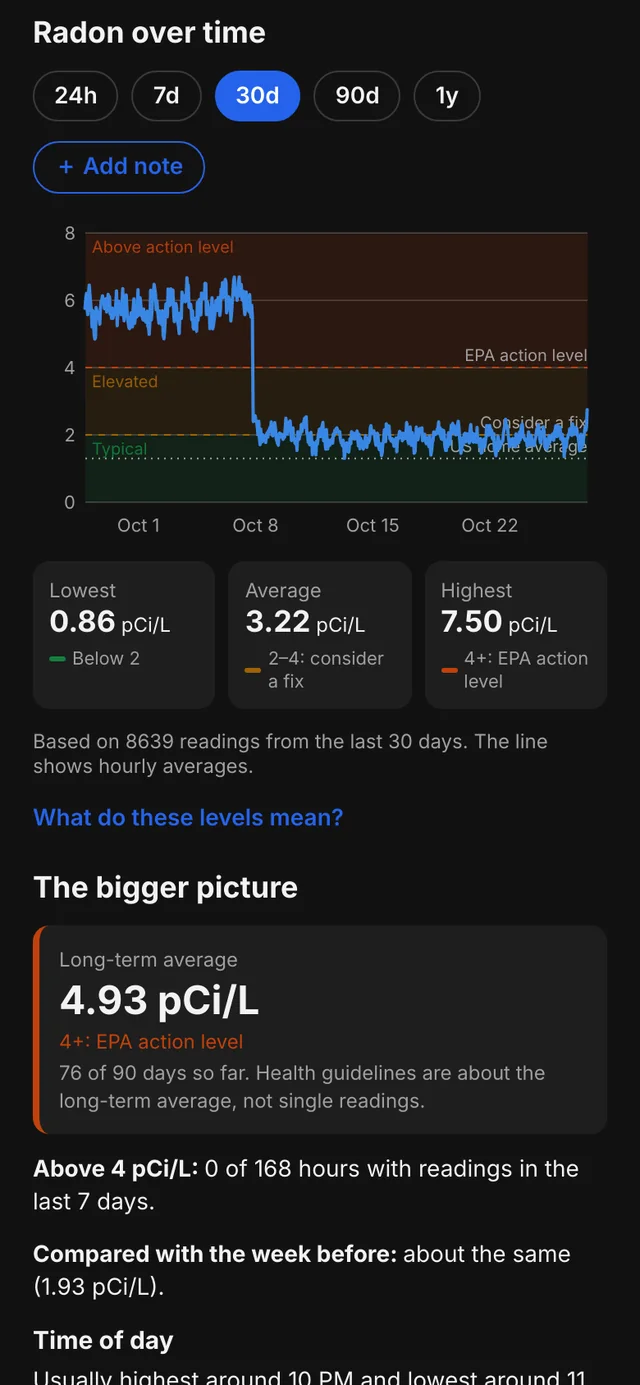
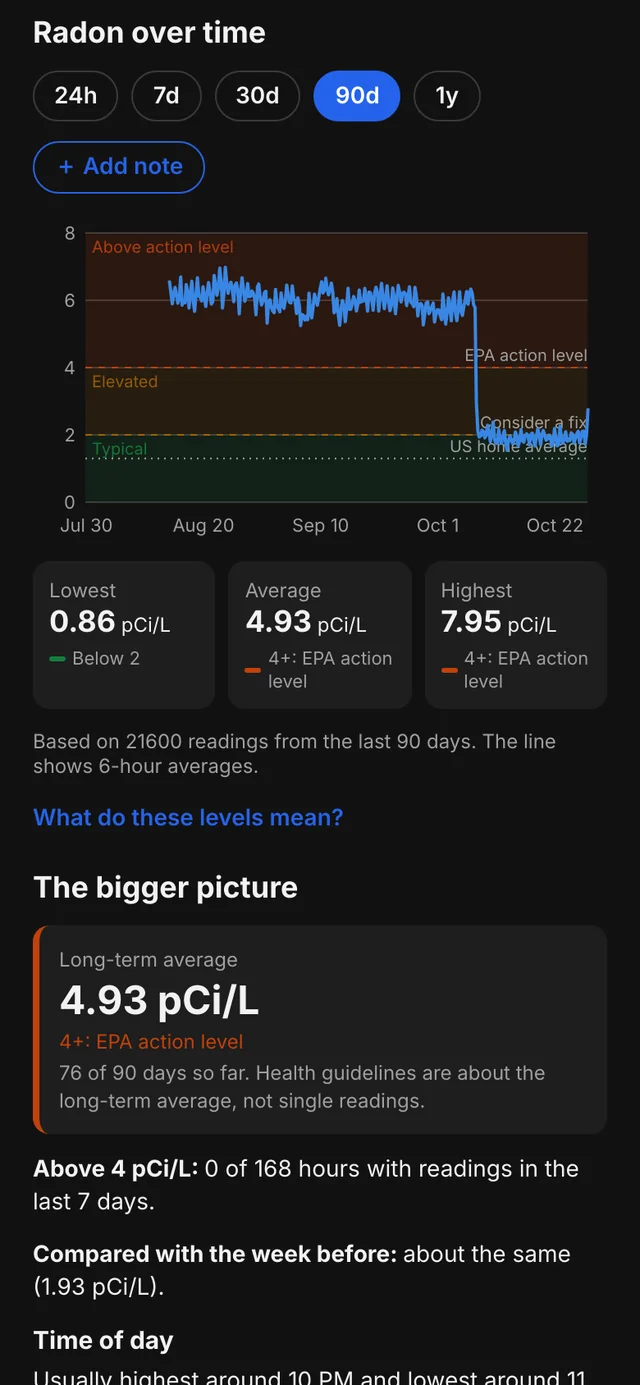
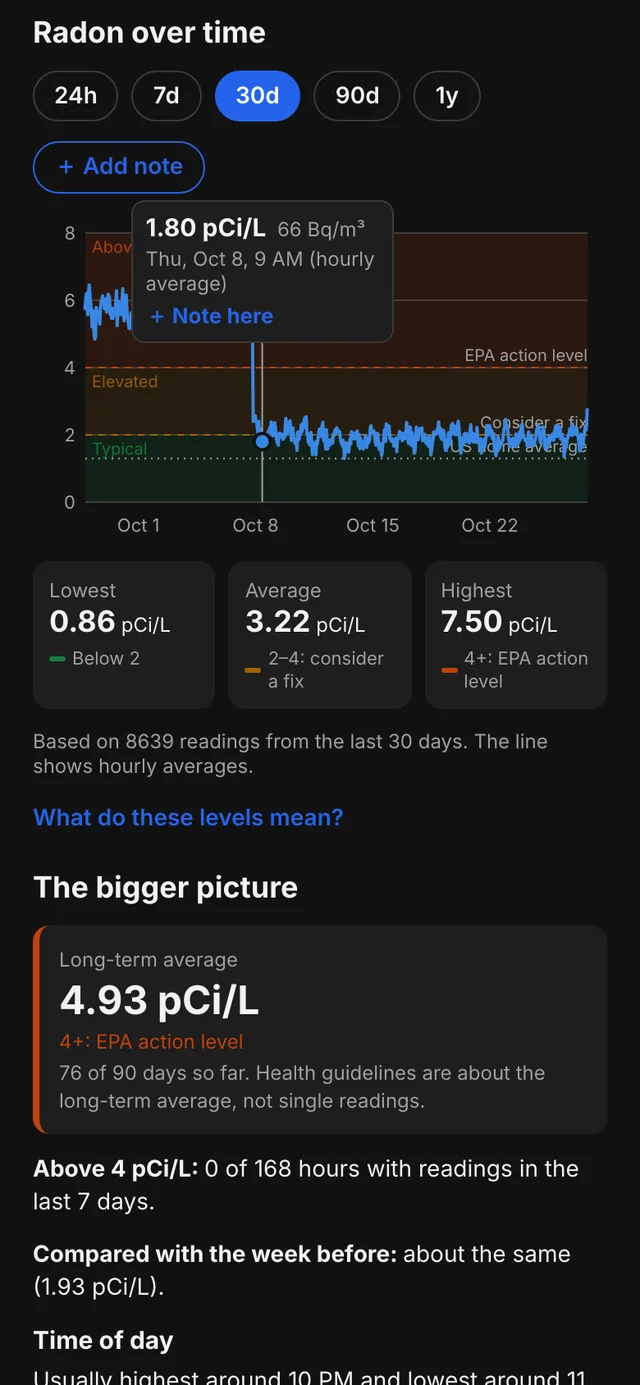
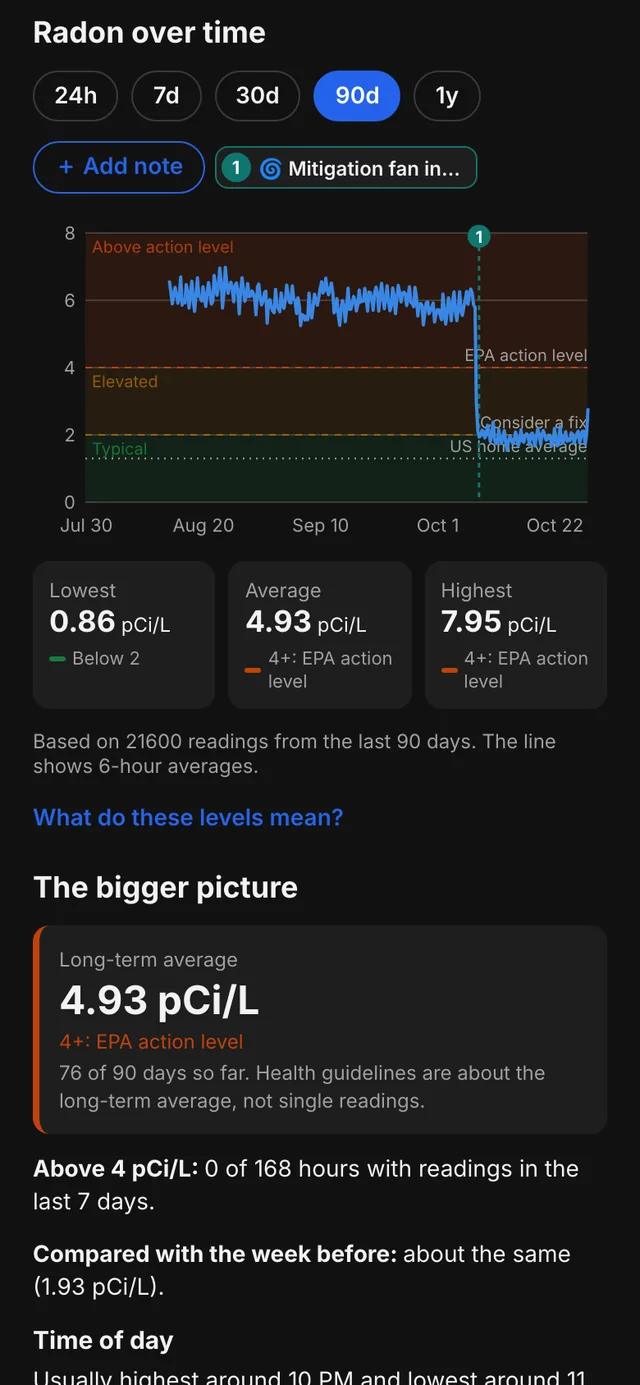
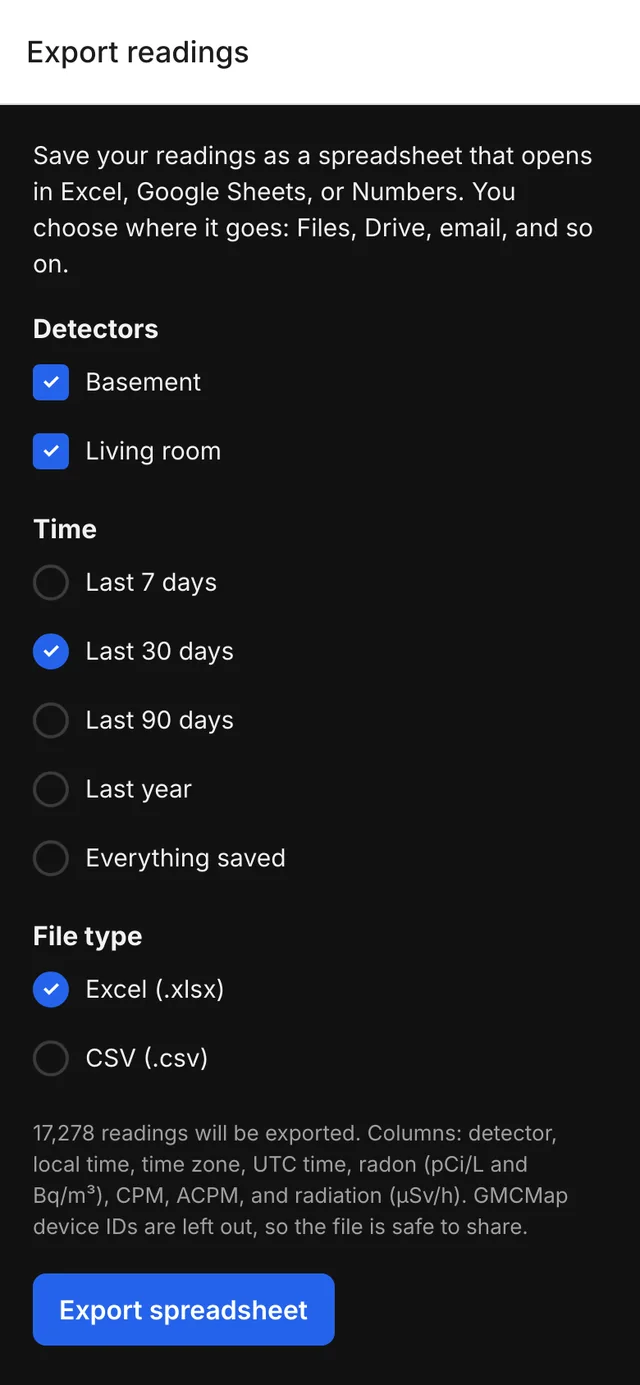
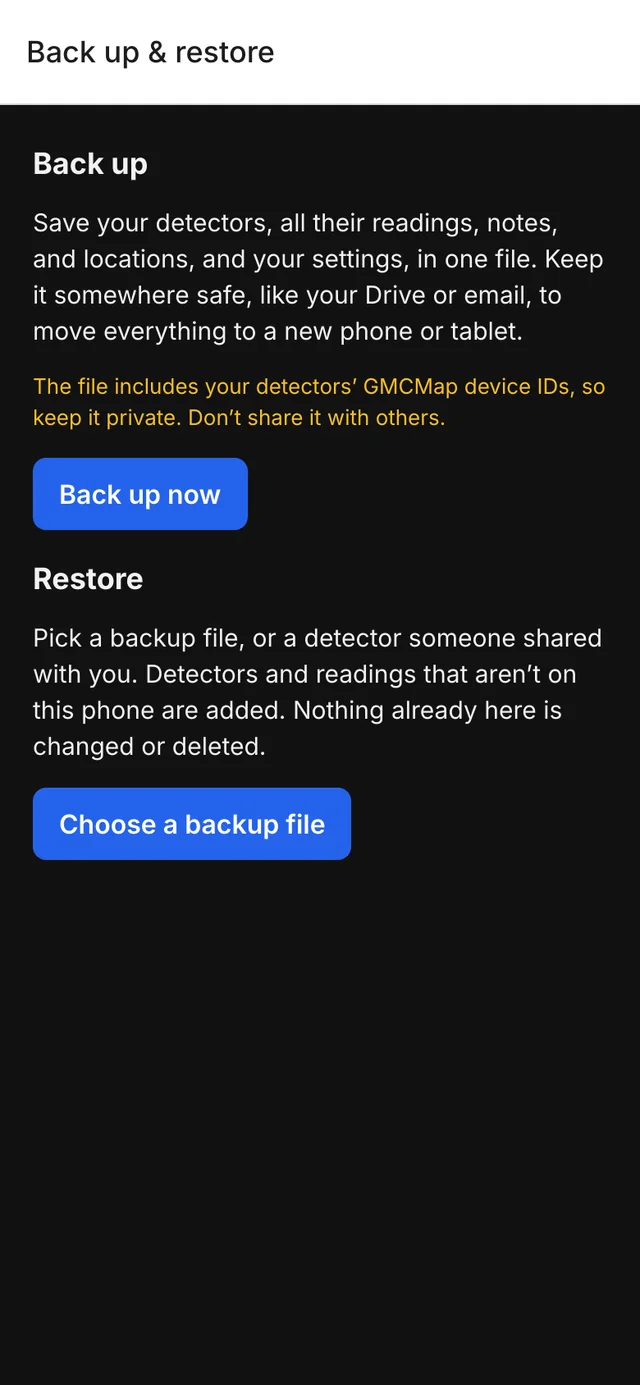
Real screens from the app, running on its own sample detectors, Basement and Living room.
A line per detector, so you can see which part of the house needs attention.
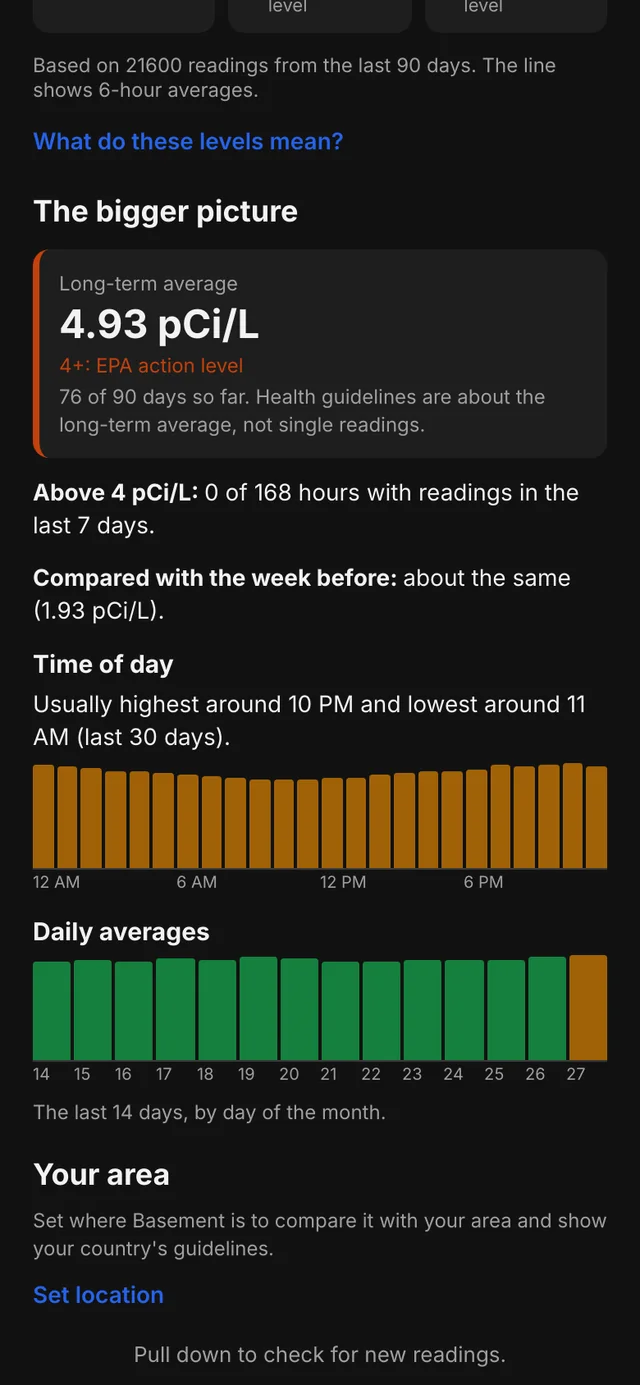
Your long-term average, plus when in the day and week radon tends to peak.
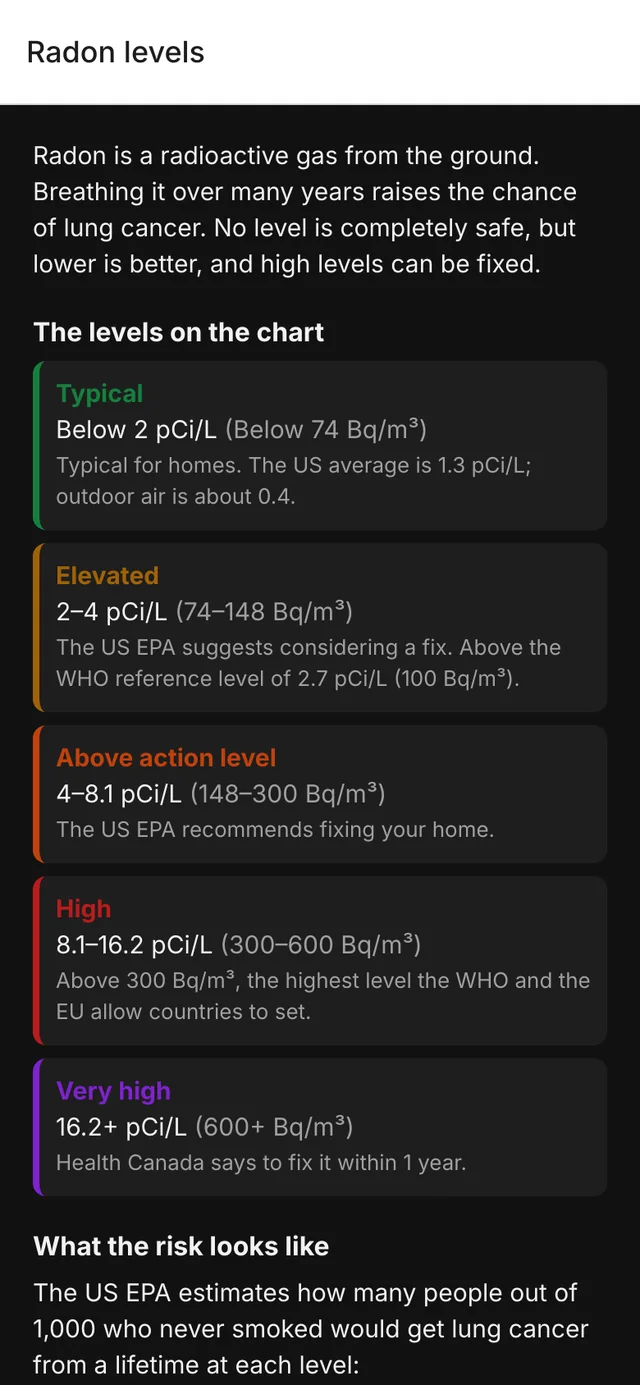
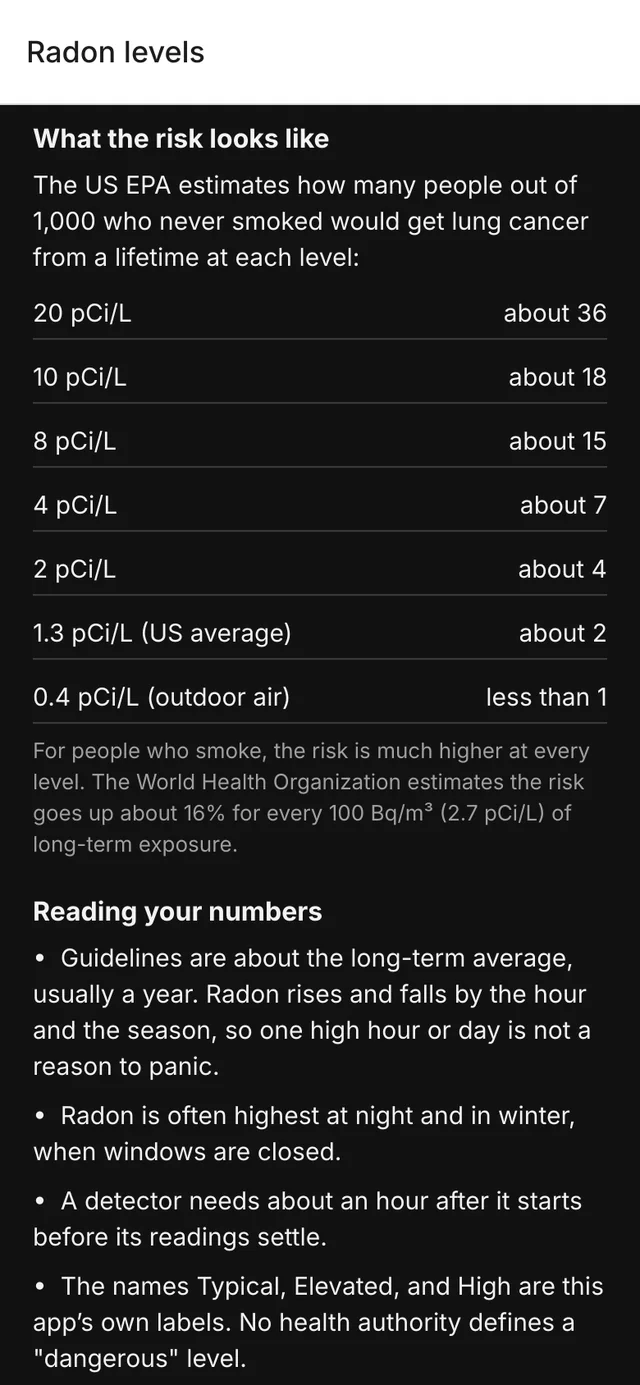
EPA, WHO and Health Canada levels explained in plain words, right in the app.
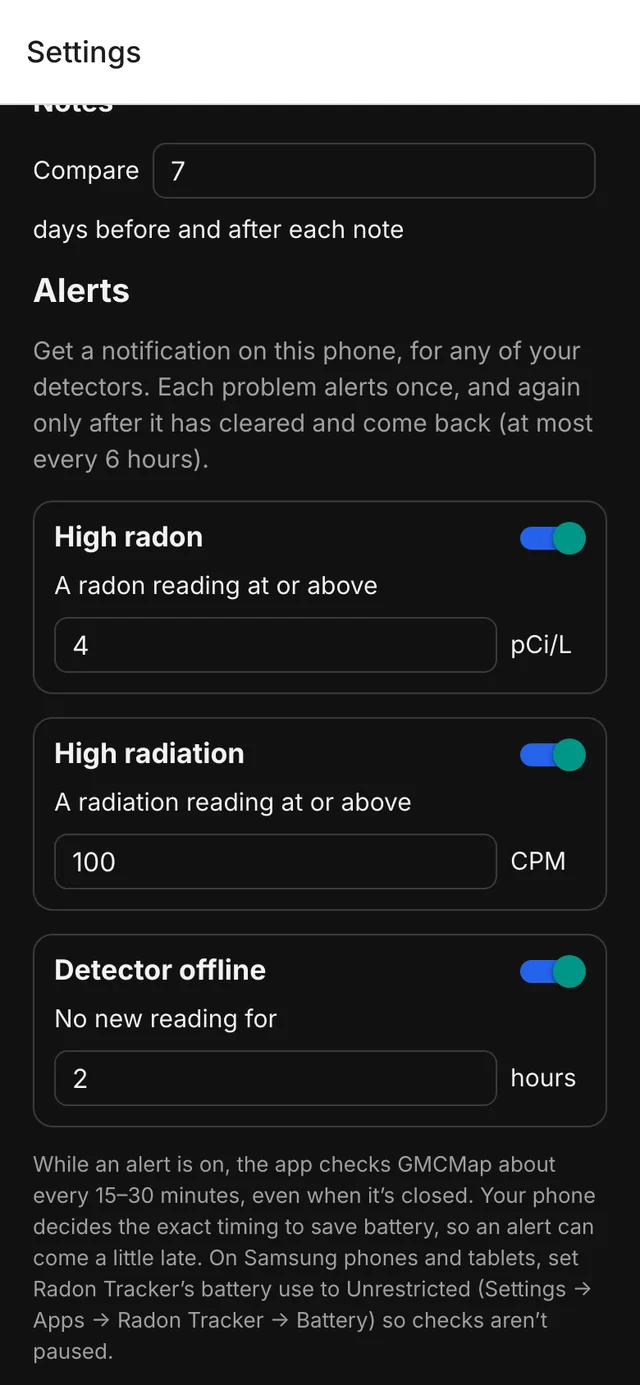
When radon reaches your level, when a detector goes quiet, and when it's back to normal.
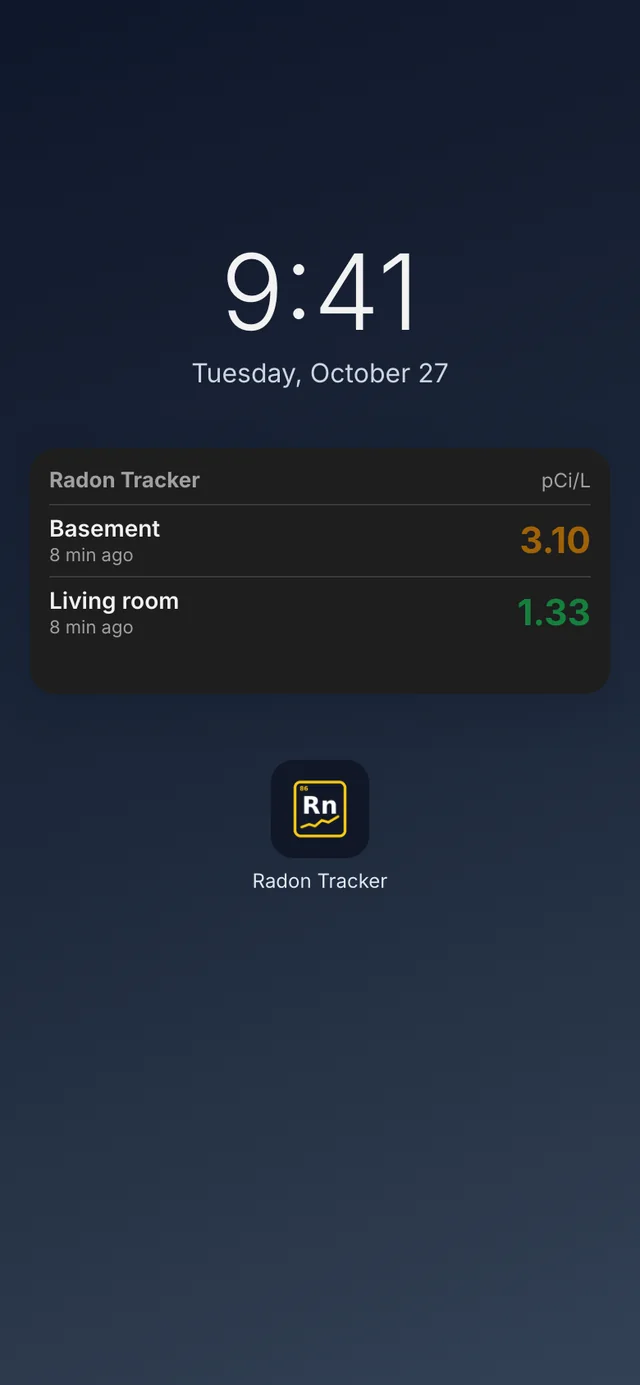
The latest reading and its level without opening the app.
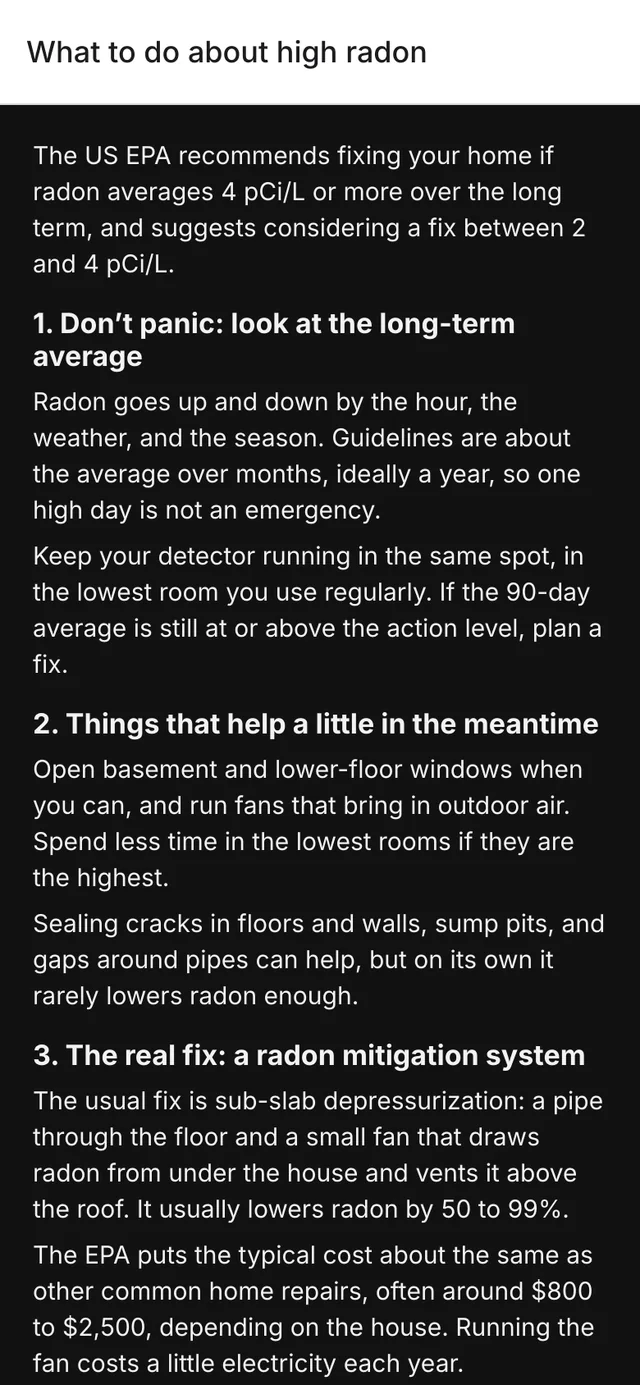
Clear next steps when readings stay high, from retesting to mitigation.
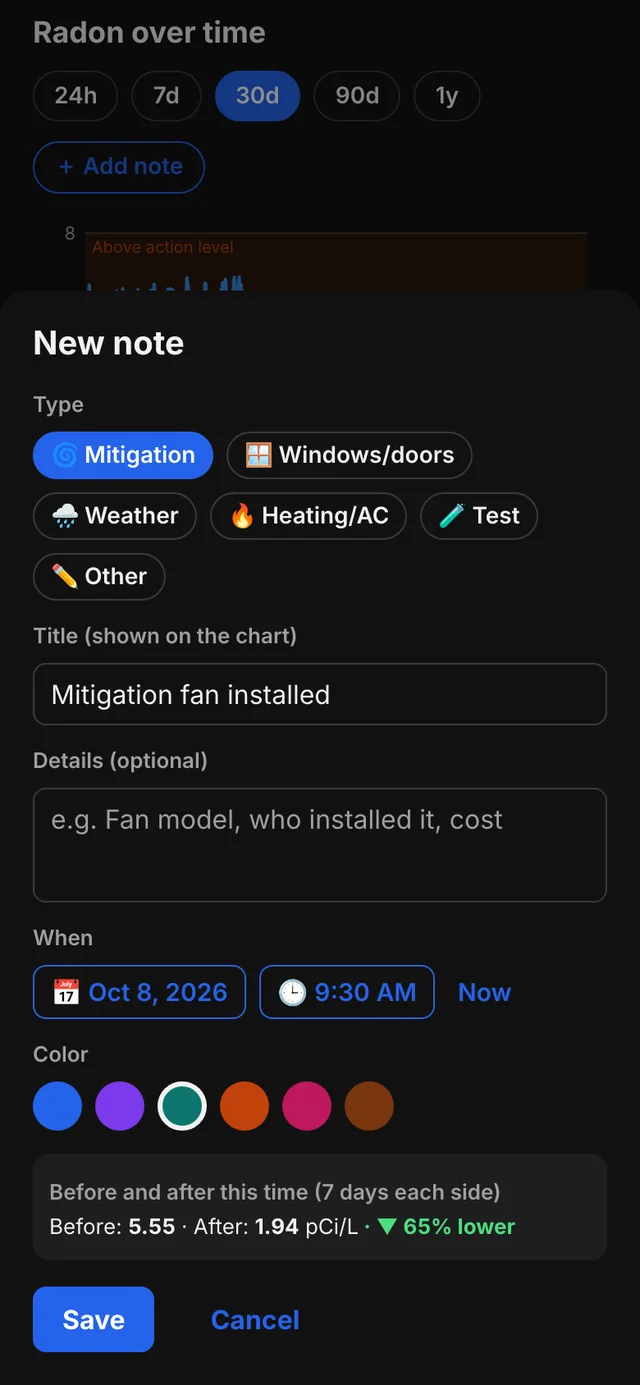
Drag to the day the readings dropped, tap Note here and pick Mitigation. The app shows the before and after, here 4.99 down to 1.70 pCi/L, 66% lower, and pins it on the chart.
Eight stages from an empty project to store testing.
An empty app with tests and automatic checks from the first commit.
Confirmed the detector network gives clean, regular readings before building on it.
Detectors, live readings, guidance colors and charts.
Icon, About screen and a privacy policy.
Long ranges, guideline lines, and location and county data.
Background alerts, the home-screen widget, notes and exports.
Shareable detectors, and iPhone and iPad support.
The first-run tour, a Google Play closed test and iPhone beta testing.
Google Play and the App Store, once testing wraps up.
Radon Tracker works with GQ GMC radon detectors through GMCMap. It is not affiliated with GQ Electronics. Readings and guidance are informational and are not a substitute for professional testing or mitigation advice. Screens use the app's own sample detectors and readings.
Sensors, feeds and spreadsheets turned into clear, trustworthy apps people check every day.